


Tracking Real GDP Growth
Gross domestic product (GDP) gives an aggregate measure of economic activity. An economy’s real GDP fluctuates over time, with periods of increasing and decreasing output around an estimated long-term trend.
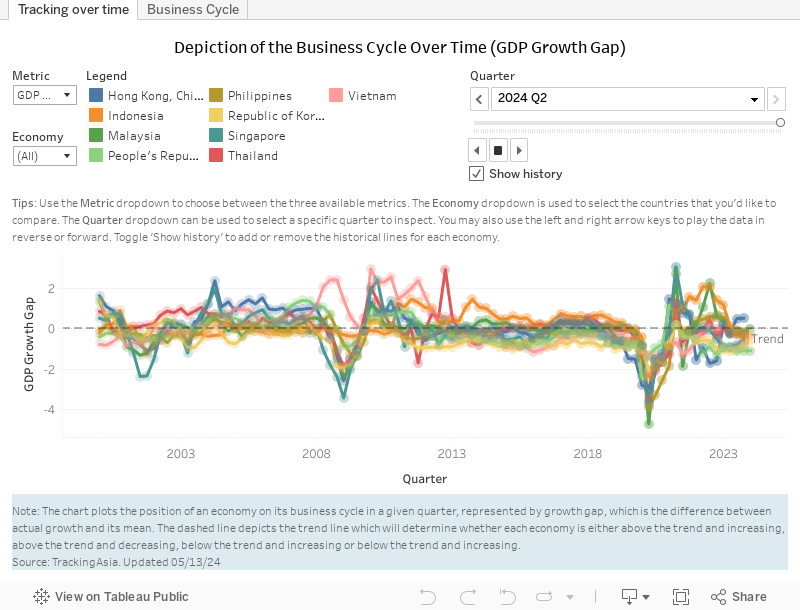
The deviation of GDP growth from its trend, called the GDP gap, is a popular indicator of whether economic resources are being fully utilized, strained, or underperforming. Periods of economic expansion alternate with periods of slowdown. The so-called business cycle is inferred when quarterly data on real GDP and its components are released by statistical agencies, though this data may be published with a lag—sometimes several weeks after the quarter has ended. Various methods can be applied to extract the cycle and to determine the turning points.
A goal of policy makers is to ensure economic stability and sustained growth—and achieving both requires timely macroeconomic monitoring. READ MORE
Gross domestic product (GDP) gives an aggregate measure of economic activity. An economy’s real GDP fluctuates over time, with periods of increasing and decreasing output around an estimated long-term trend.
The deviation of GDP growth from its trend, called the GDP gap, is a popular indicator of whether economic resources are being fully utilized, strained, or underperforming. Periods of economic expansion alternate with periods of slowdown. The so-called business cycle is inferred when quarterly data on real GDP and its components are released by statistical agencies, though this data may be published with a lag—sometimes several weeks after the quarter has ended. Various methods can be applied to extract the cycle and to determine the turning points.
A goal of policy makers is to ensure economic stability and sustained growth—and achieving both requires timely macroeconomic monitoring. READ MORE
Economic Activity Index
The Economic Activity Index (EAI) combines monthly information from a variety of categories and sectors for an economy so that the business cycle can be closely tracked.
As quarterly GDP data are often released with a lag, the EAI fills the information gap by giving reliable and timely monthly estimates of an economy’s business cycle so that rapidly changing macroeconomic conditions can be monitored. The EAI tracks economic activity since it is a composite of an economy’s monthly data, drawn from six categories or sectors—consumption, investment, trade, government, financial, and external.
The idea behind this approach is that the business cycle is pervasive across an economy, covering households, firms and producers, and governments. Hence, the common factor extracted from various categories and sectors can be useful for tracking overall economic and business cycle activity. READ MORE
Economy |
GDP |
Inflation |
Manufacturing PMI |
Industrial Production |
Exports |


GDP = gross domestic product, Q = quarter.
Note: The needle shows the position of an economy in the business cycle, represented by the GDP growth gap, in the quarter for which real data are available from statistical sources. The Economic Activity Index is shown for the current month. The latest position of the index is compared with the position in the previous quarter or month. The colors of the dial indicate whether the business cycle is below the estimated trend and gives information about the state of economic activity: decreasing (red), below trend but increasing (yellow), above trend but decreasing (blue), or above trend and increasing (green). READ MORE
Source: TrackingAsia.
TrackingAsia is a simple tool that brings together a broad set of economic information to give a timely measure of macroeconomic activity in selected economies in Asia. Its framework can complement the monitoring toolkit of decision makers and economy watchers to capture the state and course of Asian economies.
