The business cycle, represented by fluctuations in real GDP per capita around a long-term estimated trend, can gauge the state of an economy. But data on real GDP are often not timely and hence the grasp of overall cyclical conditions is not as current as required for real-time decision making. Even though GDP of the previous quarter is released with fairly long lags in many Asian economies, other statistical indicators are available every month that contain an abundance of information about activity in various sectors and the aggregate economy.
The TrackingAsia project designed the Economic Activity Index as an indicator to capture economic activity so that business cycles can be tracked monthly. The predicted metric draws data series for each economy from six categories and sectors—consumption, investment, trade, government, financial, and the external sector—and identifies the broad groups that are driving economic expansions and downturns, historically and currently.
Business cycles comprise upturns and downturns in aggregate measures of economic activity. In TrackingAsia, business-cycle fluctuations are measured in terms of the growth rate of real GDP around a long-term trend, called the growth gap.
A business cycle is characterized by four phases, depending on whether the growth rate is one of the following:
- Above trend and accelerating: the economy is recovering from a trough and moving towards its potential.
- Above trend but decelerating: the economy is expanding further and moving towards a peak; the growth will eventually cross the line of long-term trend growth.
- Below trend and increasing: the economy is slowing, moving away from a peak and the output gap is closing.
- Below trend and decreasing: the economy is in recession, moving towards a trough as resources are underutilized.
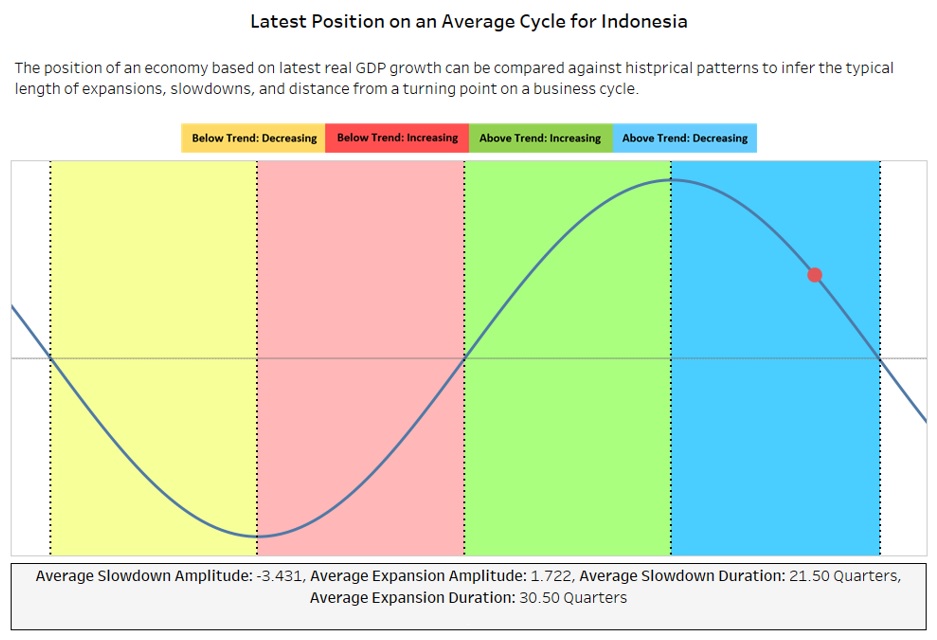
The duration of one cycle is the number of quarters from a peak to the next peak. A slowdown is a period from a peak to a trough; an expansion is a period from a trough to a peak. The height of the cycle from the peak or trough to the zero-trend line is called the amplitude.
Using historical quarterly real GDP per capita, the growth gap cycle is extracted and turning points—peaks and troughs—are identified. Based on historical patterns in this data, the average duration of a cycle, expansions, slowdowns, and amplitude are computed. The position on the cycle in the latest quarter can be compared with the summary statistics to gauge how many quarters expansions and slowdowns typically last, and how far an economy is from turning direction. The red circle indicates the latest position of the economy based on the EAI metric.
The EAI represents a predicted GDP growth gap value that is derived by feeding multiple indicators of economic activity into a trained machine learning algorithm. Weights are then generated based on each indicator’s relative importance to every single prediction. Indicators, which may differ by economy, are selected from the six categories and sectors of data—consumption, investment, trade, government, finance, and the external sector. The aggregate weighted importance of these six categories form the ‘explanation’ for EAI predictions. This data is available at a monthly frequency, the details of which are available in Resources.
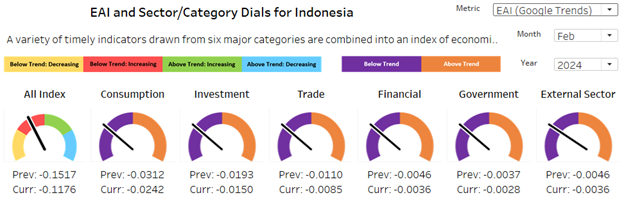
Note: When inspecting the dashboards, you will see dropdowns to switch between traditional indicators and Google Trends indicators for EAI values. The Google Trends based EAI is generally able to produce activity indices in a timelier manner as these indicators are updated in real time.
The following is the methodology used to compute the EAI:
Monthly data that feed into the respective machine learning models are extracted using Python based APIs for CEIC and Haver and compiled from various sources for available years and transformed, using these steps:
- An indicator with multiple base years is spliced to create a longer time series. As the rule of thumb, the latest base year is used while splicing.
- Data that are seasonally adjusted by source are always preferred. If this data is not available and seasonality is detected, the data are treated using the X13-ARIMA package in EViews, a statistical software used mainly for time-series analysis.
- Series in year-to-date format are transformed into monthly values by deducting the values of the previous month in a year from the values of each month of the year.
- Series are converted to logarithm values. Variables that are in percentages, rates, and indexes are retained as is.
- The dataset is balanced; that is, ragged ends in variables are avoided by completing the indicator series that has different release dates using an AR(1) model.
- All indicators are rescaled to have mean zero and standard deviation of one before using principal components analysis.
Moreover, a secondary EAI is computed using Google Trends keyword search volume data that is published weekly. The following steps are then followed to prepare this data for modeling:
- The common time trend is extracted to address the downward trend of search volume indices that can be attributed to the increasing amount of searches being conducted over time.
- Repeated patterns caused by recurring seasonal trends are addressed by computing the log difference between each value and their corresponding value from the same month in the previous year.
- Changes in the data collection methodology of Google Trends in January 2011 and January 2016 are addressed by subtracting the difference between data values from January 2011 and January 2010, the value of which is then subtracted from each value after January 2011. This process is repeated between January 2016 and January 2015.
- Data frequency is matched across datasets.
Next, the extracted and cleaned data is used for the modeling and prediction process:
- The data is sorted in ascending order based on the date and the first 50% is separated to be used as the initial training set, while the first 50% of the previously compiled GDP growth gap values are used for the target set.
- The training data is used to train a machine learning model which may be different depending on the country.
- Data for the next available month are inputted into the trained model to generate a new prediction.
- The next available GDP growth gap value is added into the target set and the next available indicator data row is added into the training set to retrain the model for the next prediction.
- If there are no more actual GDP growth gap values available, then the previous predicted value is added into the target set.
- The last three points in the process are repeated until there are no more available indicator values.
Variable selection for constructing the EAI
To identify the relevant indicators for inclusion in the EAI using the machine learning method outlined earlier, three alternative selection methods are used. The first is a correlation method, where the correlation of each indicator with the GDP growth rate is computed using Pearson’s correlation. Indicators with less than 50% correlation are removed. The other two methods belong to model averaging techniques—Bayesian model averaging and weighted-average least squares.
Among the automatic variable selection processes to construct the EAI, the method which best tracks GDP gap cycles is identified. To improve the fit, an ad hoc examination—using economy-specific knowledge—of the existing set of indicators is conducted.
TrackingAsia flowchart
Click here for a graphic representation of the sequence of steps used in the indicator selection process for constructing an Economic Activity Index.
Click here for a graphic representation of the sequence of steps used in the indicator selection process for constructing an Economic Activity Index.
Interpreting the EAI
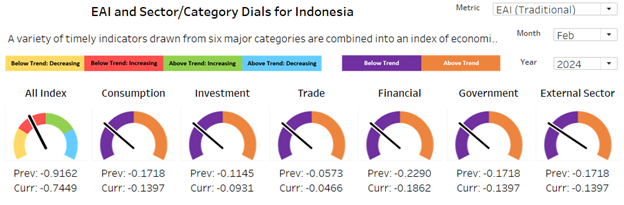
The EAI is a prediction of the value of the GDP growth gap for a certain month. It can be interpreted as the likely GDP growth gap in the months where actual values are yet to be observable. Because growth gap is computed instead of just growth, together with the normalization of values, positive values indicate above-average economic activity and negative values indicate below-average activity. The scale is in standard deviations from a trend rate of growth. The sector/category-specific indexes are interpreted similarly.
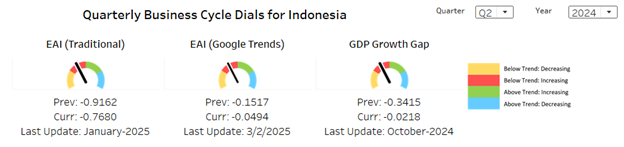
The monthly traditional EAI suggests the economy in Feb 2024 was more unfavorable than in January. The index rose from –0.92 to –0.74. Being in the red zone, the economy was still below its long-term trend but is picking up. In the tracker, all sectors and categories are positioned below zero (purple). The monthly Google Trends based EAI tells the same story with EAI picking up and remaining in the red zone.
The views expressed are those of the authors and do not necessarily reflect the views and policies of the Asian Development Bank.
See https://www.adb.org/terms-use
For further details and information about TrackingAsia, email trackingasia@adb.org

